Table of Contents
Introduction
The Discrete Time Fourier (DFT) and Fast Fourier Transform (FFT) are incredible tools for spectral analysis. Read on to find out why a windowing function can dramatically improve their performance even further.
More DSP blogs!
Windowing Functions for the DFT
The DFT is an incredible tool for spectral analysis. But like all tools, it needs to be used properly and can benefit from an upgrade. A windowing function comes at the cost of additional computation but greatly improves the overall performance.
The DFT assumes the input time-series is periodic [oppenheim1999, p. 542]. such that the signal wraps from the last sample to the first input sample. Large transitions from the last sample input sample to the first input sample will result the creation of wideband spectral noise which degrades the quality of the resulting frequency analysis.
However, most signals will not be perfectly periodic when computing the DFT and this is where the windowing function becomes useful. Windowing functions drive the beginning and end of the input time-series to zero. Windowing suppresses transitions on the boundaries of the input signal thereby reducing any wideband spectral noise that would have been created otherwise.
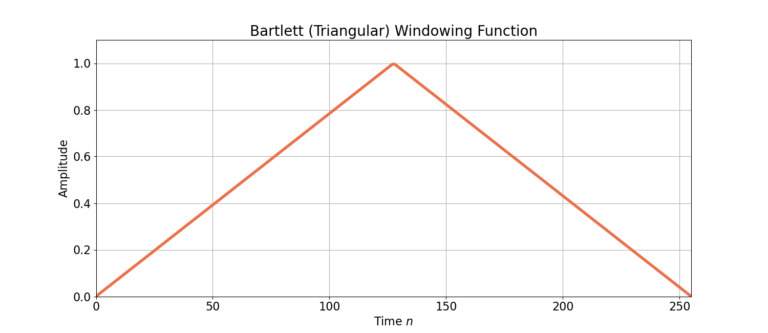
Figure 1 shows the time-domain response of a Bartlett window, defined as w[n].
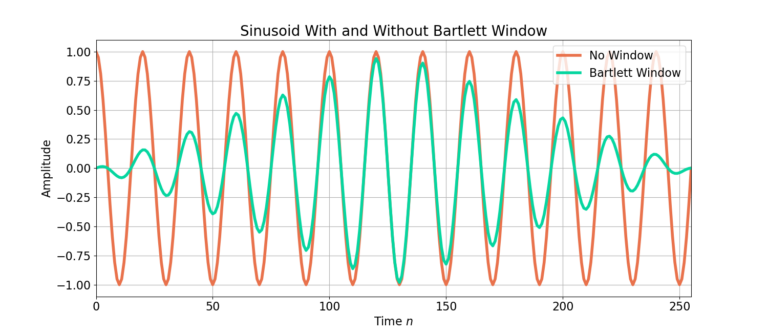
A sinusoid with frequency ![]() ,
,
(1) ![]()
is plotted in Figure 2, along with a windowed version x[n]w[n] of the sinusoid. Notice how the sinusoid x[n] without the window is not perfectly periodic, such that the last sample at time n=255 does not flow smoothly into the beginning sample at time n = 0. Figure 2 shows how a windowing function drives the beginning and ending samples to zero.
Frequency Domain Analysis
Figure 3 gives the magnitude of the frequency response of the sinusoid x[n] with and without the Bartlett window. The sidelobes are substantially lower! The smallest sidelobes without a window approach -50 dB, and applying a window reduces them to -90 dB!
What’s the benefit?
The first benefit is the reduction in sidelobes reduces the amount of energy content at other frequencies which improves the overall accuracy of the spectral estimate. Recall that the DFT of an infinitely complex sinusoid is an impulse function in the frequency domain, meaning it has energy at a single frequency. However, the unwindowed spectral estimate in Figure 3 shows energy distributed across the entire bandwidth. Compare against the windowed version which has a higher proportion of it’s energy located around the frequency of the sinusoid, a more accurate spectral estimate.
The second benefit is the ability to resolve lower power signals. Using the unwindowed spectral response, signals which have a peak lower than -40 dB would not be able to be seen. However, the Bartlett window creates another 50 dB worth of dynamic range in the spectral estimate.
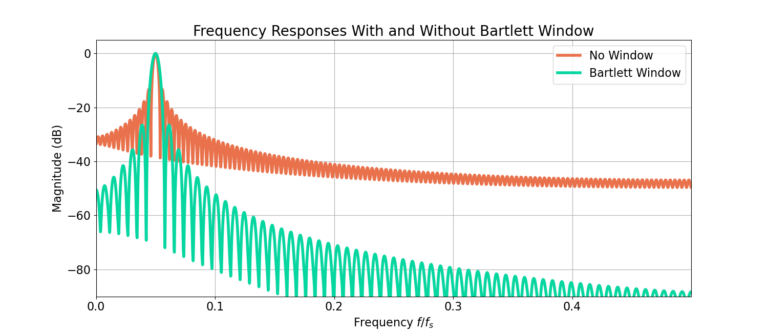
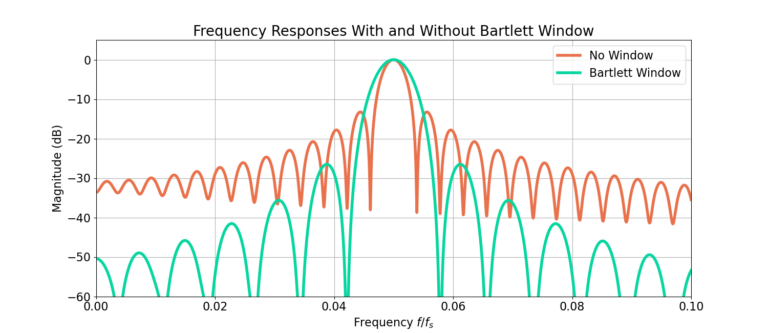
Figure 4 zooms in around the peak of the frequency response. The largest sidelobe without windowing is – 13 dB, and applying a window reduces that to -26 dB. However, the reduction in sidelobes does come at the cost of smearing the the frequency response as seen in the increased width of the main lobe.
The last trade-off is the increase in computation: implementing a windowing function requires a element-by-element multiply of the windowing function with the input signal, x[n]w[n]. However, this is almost always a worthwhile trade.
Conclusion
A windowing function sends the beginning and ending samples of time-series into zero, forcing non-periodic signals approximate a periodic function. Examples how how the Bartlett window improves the spectral estimate of a sinusoid by reducing the sidelobes by 50 dB over the unwindowed estimate. However, the trade-off is the widening of the main-lobe and the computational cost to implement the multiplies.
More DSP blogs!
![A BPSK signal s[n], real Gaussian noise w[n], and the received signal x[n] = s[n] + w[n] for SNR = 20 dB](https://www.wavewalkerdsp.com/wp-content/uploads/wordpress-popular-posts/15621-featured-125x100.png)
![Figure 1: The two sequences for the autocorrelation of x0[n] and x0[n].](https://www.wavewalkerdsp.com/wp-content/uploads/wordpress-popular-posts/5515-featured-125x100.png)
