Table of Contents
Introduction
Logarithms, exponents and base numbers can be hard to think about at times. This blog visualizes these types of numbers using plots to show how they all relate to one another.
Be sure to check out a previous blog post explaining the math of logarithms and exponents!
Check out these other blogs on DSP math:
Plotting Exponentials
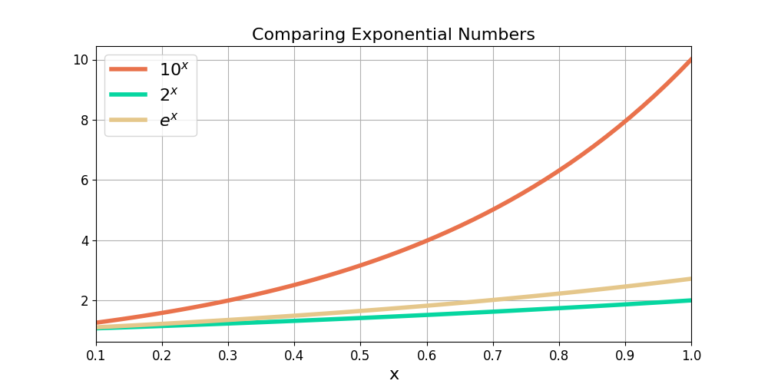
Figure 1 plots the exponential numbers ![]() ,
, ![]() , and
, and ![]() . The base number determines how quickly the exponential number grows. The larger the base number the faster the growth.
. The base number determines how quickly the exponential number grows. The larger the base number the faster the growth.
Log10 Plot
Figure 2 shows the linear plot of x versus ![]() . In this plot the number
. In this plot the number ![]() appears exponential on the y-axis for increases in x. The base-10 logarithm returns the exponent of
appears exponential on the y-axis for increases in x. The base-10 logarithm returns the exponent of ![]() , which is x, which appears linearly on the plot.
, which is x, which appears linearly on the plot.
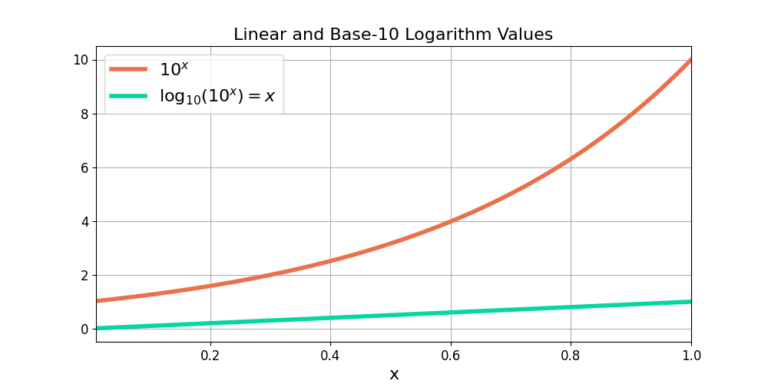
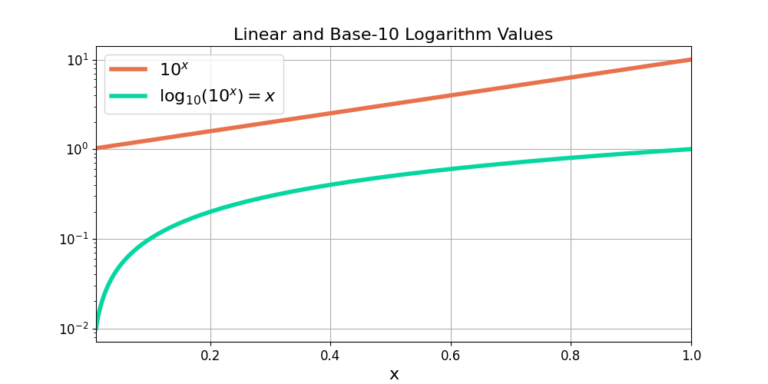
Figure 3 is a logarithmic plot on the y-axis, referred to as a semilog plot. The logarithmic plot converts the numbers using log10() before plotting them. Therefore the y-axis shows the exponential ![]() as linear,
as linear,
(1) ![]()
and the number x as logarithmic,
(2) ![]()
Log2 Plot
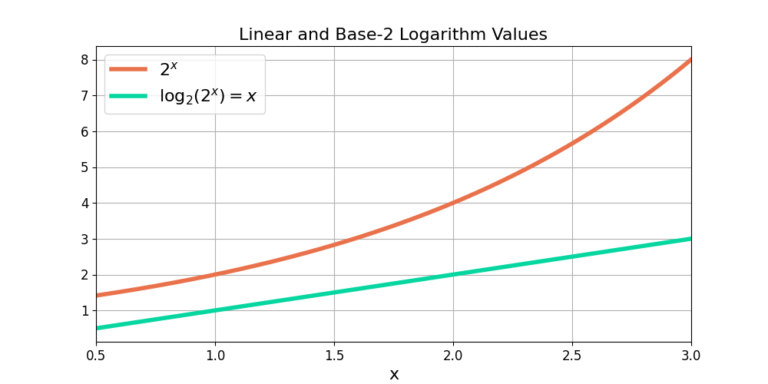
Figure 4 shows the plot for a base-2 exponential. The figure shows a similar shape as Figure 1, just with a base number of 2.
Natural Log (Log e) Plot
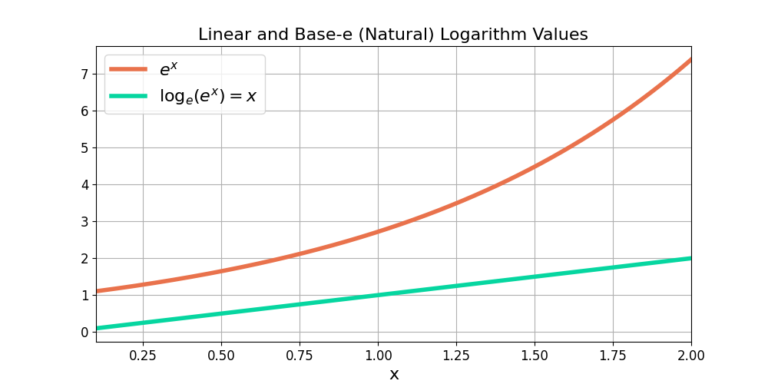
Figure 4 shows the plot for a base-e exponential. The figure shows a similar shape as Figures 2 and 3, just with a base number of e.
Conclusion
A linear plot will show an exponential number, say ![]() , as exponential and a linear number x as linear. However a logarithmic plot, or semilog plot, will show an exponential number as linear and a linear number as logarithmic.
, as exponential and a linear number x as linear. However a logarithmic plot, or semilog plot, will show an exponential number as linear and a linear number as logarithmic.
Khan Academy also has a great video on explaining logarithms you can check out here.
Check out these other blogs on DSP math:

