Table of Contents
Introduction
This blog gives a couple of examples for how the PSD for QPSK, AWGN and sinusoidal signals are estimated using the Bartlett Method.
More DSP blogs!
Examples Overview
A previous post discussed the mathematics behind the power spectral density (PSD) and Bartlett’s method of estimating the PSD. The following images give examples of PSD estimates using Bartlett’s method for quadrature phase shift keying (QPSK), additive white Gaussian noise (AWGN) and sinusoidal signals.
All PSD estimates use an FFT size of 256 bins but with a variable number of averages. When “Num Avg = 1” then a single FFT of 256 bins is presented. However when “Num Avg = 4”, then four 256-point FFTs are averaged together. As a general rule more averages produces a plot with less variance but that is not always the case as some plots will show. Additionally, more averages require more input data which may not always be available due to hardware or signal constraints.
Bartlett Method for QPSK
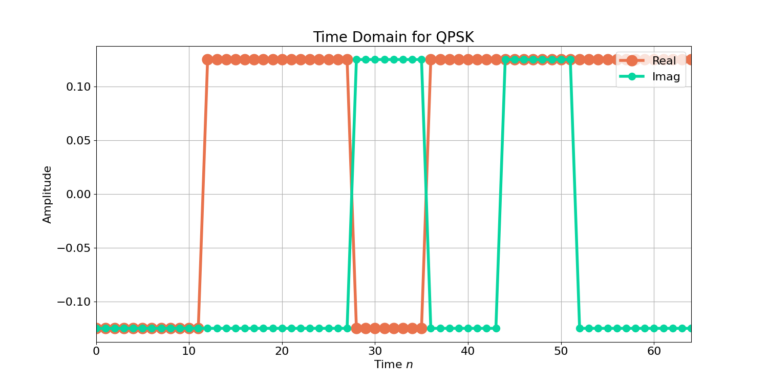
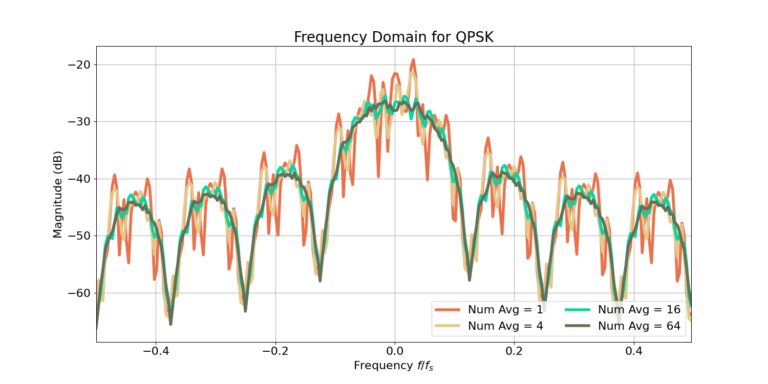
Figure 1 and 2 are the time domain and PSD estimates for a noise-less QPSK signal with rectangular pulse shaping and 16 samples per symbol. Figure 2 estimates the PSD for 1, 4, 16 and 64 FFT averages.
Notice that the more FFTs averaged the smoother the frequency response. Recall that the FFT computes the frequency response over a finite-length time-series. Therefore, the magnitude in the frequency domain will have fluctuations that correspond to the underlying time-series which do not produce a perfectly smooth plot. However, increasing the amount of data through multiple FFT averages is one way to reduce the variance of the spectral response.
Bartlett Method for AWGN
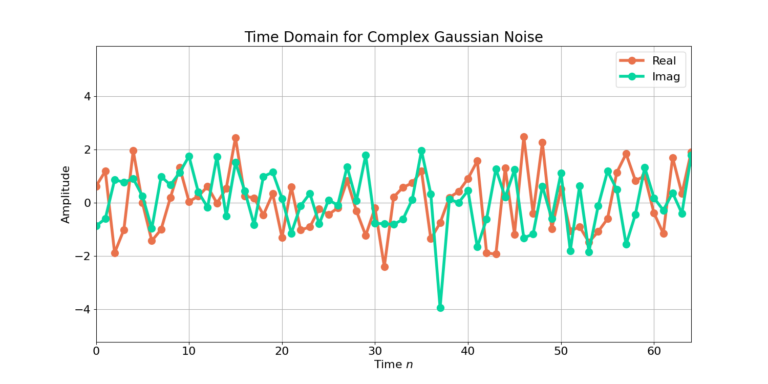
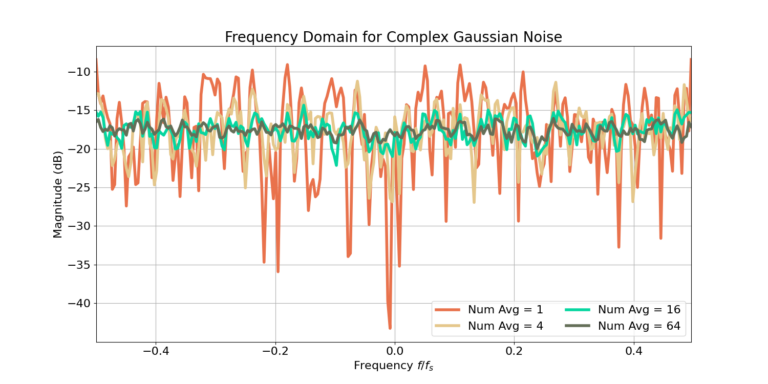
Figures 3 and 4 display the PSD estimates for additive white Gaussian noise (AWGN). The frequency response for AWGN is nominally a completely flat magnitude, however there are fluctuations due to the randomness of the waveform and the finite-time length of the FFT. Similar to the response of the QPSK signal, the more averages reduces the variations. Notice that only a single FFT produces a range of peaks and nulls in the magnitude of the frequency response of about 25 dB while increasing to 64 FFT averages decreases the range peaks and nulls to only 2 dB.
Bartlett Method for Complex Sinusoid
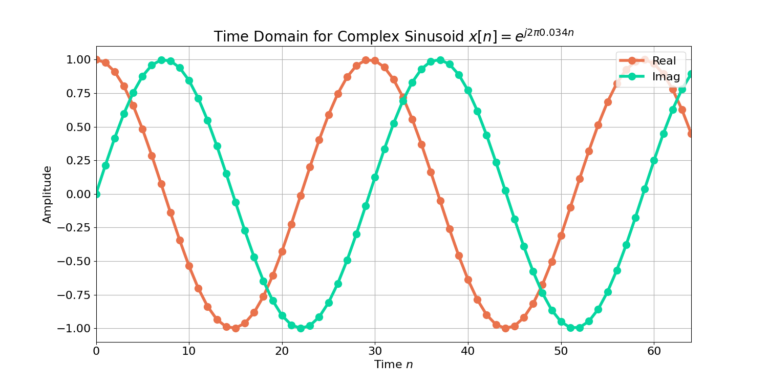
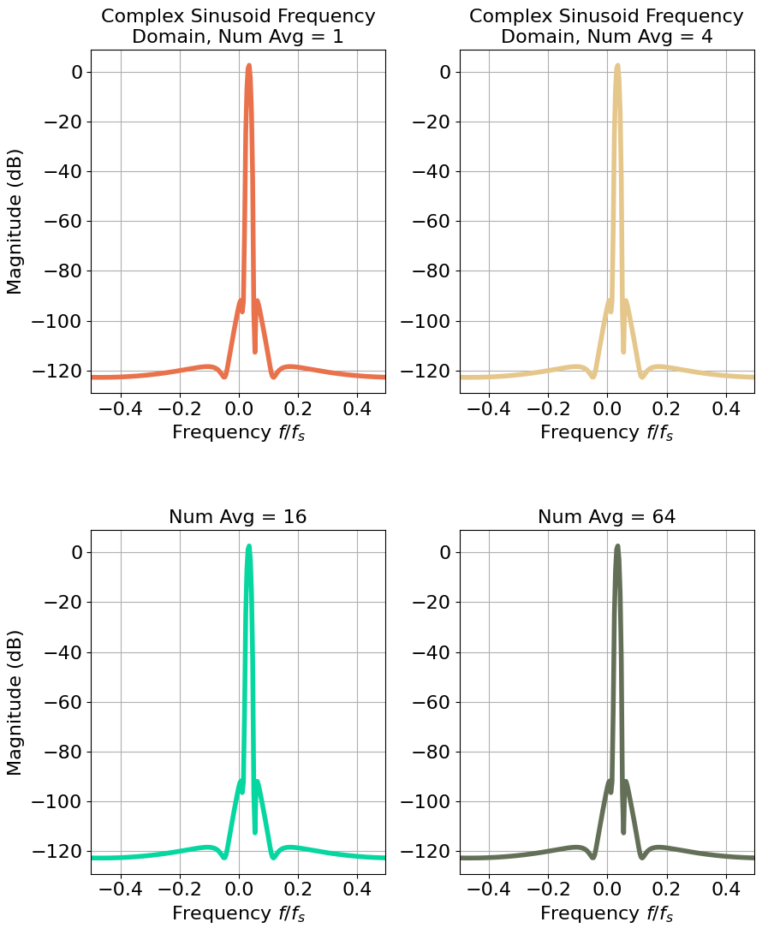
Figures 5 and 6 demonstrates the PSD estimates for a complex sinusoid. Where the QPSK and AWGN signals contain randomness, the complex sinusoid has no randomness. Interestingly, Figure 6 shows that there is no difference between the number of FFTs that are averaged!
The fluctuations in the frequency responses for QPSK and AWGN are due to the randomness in the signal, and more FFTs are needed to average or smooth out the frequency response. However, since there is no randomness with a complex sinusoid there is no benefit to applying the Bartlett method.
Conclusion
The Bartlett method is used to estimate the power spectral density (PSD) of a signal. Averaging more FFT responses reduces the variance in the frequency response produced by randomness in the waveform.
More DSP blogs!
![A BPSK signal s[n], real Gaussian noise w[n], and the received signal x[n] = s[n] + w[n] for SNR = 20 dB](https://www.wavewalkerdsp.com/wp-content/uploads/wordpress-popular-posts/15621-featured-125x100.png)
![Figure 1: The two sequences for the autocorrelation of x0[n] and x0[n].](https://www.wavewalkerdsp.com/wp-content/uploads/wordpress-popular-posts/5515-featured-125x100.png)

