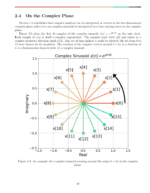
Table of Contents
Introduction
This blog describes how to normalize a windowing function to have unit average power. Windowing functions are useful in spectral analysis but need to be applied correctly without distortion of the power of the underlying time domain signal.
Related Blogs:
Windowing Function in Time Domain
Windowing functions shape the impulse response of a signal prior to computing the discrete-fourier transform (DFT) or fast-Fourier transform (FFT) and therefore produce beneficial effects for spectral analysis and power spectral density (PSD) estimation. Figure 1 shows an example Blackman-harris windowing function in the time domain.
The window was created with SciPy’s windows function:
import scipy.signal
win = scipy.signal.windows.blackmanharris(256)
Normalizing the Window Power
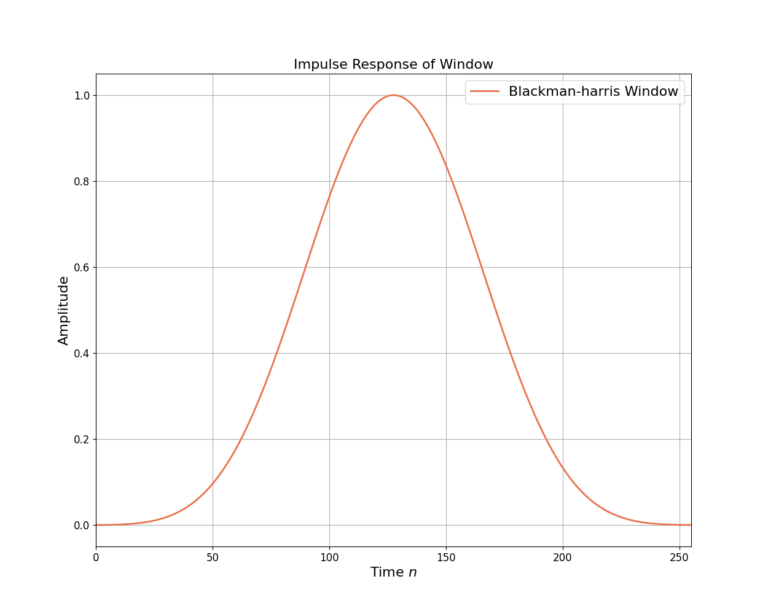
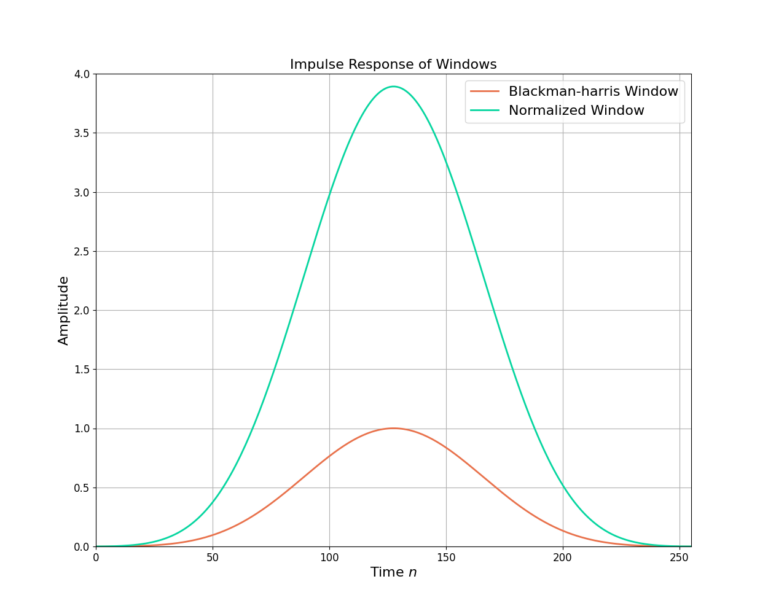
Note how the windowing function amplitude goes to zero at the beginning and end of the windowing function impulse response. While the shaping of the impulse response has benefits, it also changes the power of the signal which needs to be accounted for.
The power P of the window w[n] is calculated according to:
(1)
and the normalized window is therefore:
(2)
Equations (1) and (2) can be implemented in Python by:
import numpy as np
P = np.mean(np.abs(w)**2)
wnorm = w/np.sqrt(P)
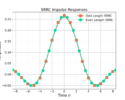
Figure 2 demonstrates the impulse response for the Blackman-harris window along side the normalized version. Note how normalizing the window to unit power increases the amplitude levels.
Window Example with a Complex Sinusoid
Figure 3 shows a sinusoid in the time domain along side a windowed version and a version in which the window has been normalized to unit energy. Note that in the middle plot the windowing function reduces the overall amount of signal present since the tails are drive to zero amplitude, reducing the power of the windowed signal. Normalizing the window to unit power therefore counteracts the reduction in power coming from the tails of the windowing function and increasing the amplitude levels throughout.
Frequency Domain Impacts of Normalization
The impact to a signal’s power due to averaging has an impact on the frequency response as well. Figure 4 plots a Blackman-harris window with and without a power normalization. Note how the normalized window increases the magnitude level of the frequency response.
Figure 5 shows a similar result with the magnitude of the frequency response for a complex sinusoid, where the power level is increased due to the normalization of the window.
Also note how the application of the window in both cases reduces the sidelobes when comparing against the frequency response without the Blackman-harris window. The peak power for the frequency response without the window is lower due to the fact that the total energy is spread across the many sidelobes. Alternatively, the normalized window produces a more reliable higher peak power estimate because the filtering reduces the sidelobe artifacts.
Conclusion
This blog demonstrated how to compute a windowing function with unit average power, and describes that it is desirable because it preserves the underlying energy of the time domain signal.
Related Blogs: